
We explore how implicit associations with the label "autism" influence how people with the diagnosis are represented and perceived. A recent trend in public discourse has been to add descriptors to autism, such as "high-functioning" or "spectrum," possibly to minimize the perceived stigma associated with the diagnosis. We examined the colors used by researchers in poster graphs to represent the term autism. Research has indicated that the color red has implicit negative associations when evaluation of competence is salient. We found that red was used more often for groups with an autism label than other groups. Further, the use of red was less frequent when there were qualifiers for autism such as "high-functioning," "spectrum," or for Asperger syndrome. We assert that this pattern is evidence of implicit, negative societal associations with the word autism that influence discourse on the diagnosis.
In this paper, we explore the background and evolution of stigma associated with autism and the labels that characterize the disorder. In particular, we highlight the recent trends to add qualifiers, such as "high-functioning" and "spectrum" to the word autism. We put forward the idea that colors, which are one type of visual rhetoric, have implicit meanings associated with them. Red, in particular, has been shown to have negative connotations in certain contexts. We then examine the use of colors to represent autism and related labels in poster graphs, and show how red is the most common color used to represent the label "autism," and that the percentage of graphs using red decreases as qualifiers are added and especially when the word autism is eliminated from the graph. We discuss how these findings are indicative of broader social-cultural understandings of autism. Finally, we consider whether the movement away from the word autism has reinforced the stigma associated with "classic" or "low-functioning" autism, and discuss future directions of research to further investigate these issues.
Background
There have been meaningful changes in the labels used to represent individuals who are clinically diagnosed as having autism or identified as part of the "autism spectrum" (Bettelheim, 1959; Grinker, 2007; Kanner, 1949). Recently, the use of Asperger syndrome as a clinical diagnosis has greatly increased despite considerable evidence in the scientific literature that there is no meaningful categorical differentiation between people who have been labeled as having "high-functioning" autism (HFA) and those with the Asperger syndrome diagnosis (Frith, 2004; Volkmar, Lord, Bailey, Schultz, & Klin, 2004). Moreover, it is increasingly common for qualifiers to be used with the word autism, such as "high-functioning" or "spectrum disorder" (Diehl, Tang, & Thomas, in press). This increase is due in part to expanding diagnostic categories (Grinker, 2007), but it could also be the result of an attempt to decrease the stigma (both enacted and felt) associated with the diagnosis (Gray, 1993; 2002). It is possible that the reluctance to use autism as a term without qualification is the result of negative associations that are implicit or explicit, or both.
Interestingly, work on the rhetoric of disability labels has suggested that making one subgroup of a disability "less stigmatized" runs the danger of only highlighting the stigma in the "lower" end of the disability (e.g., Lewiecki-Wilson, 2003). It is certainly plausible that the rhetorical metaphor "spectrum" and other qualifiers evolved as a need to say "this is not classic autism," or "not everyone fits society's prototype of autism," or even "not all types of autism are as scary." For example, the spectrum metaphor highlights diversity. The high-functioning qualifier explicitly states that the individual is not as impaired as the rest of individuals with the diagnosis, or that not everyone fits the societal prototype of autism.
There is extant literature on how diagnostic labels influence the ways in which people are perceived and treated. It is well-documented that the use of certain labels for mental illness can have negative consequences for a person's long-term outcomes (Farrington, 1977), and for the psychological well-being of the person or their family (Green, Davis, Karshmer, Marsh, & Straight, 2005). For example, babies labeled as cocaine-exposed or depressed are more likely to receive negative behavioral ratings from adults (Hart, Field, Stern, & Johnes, 1997; Woods, Eyler, Conlon, Behnke, & Webie, 1998). Negative conceptions of mental disorder labels are present in mental health professionals as well (Hinshaw & Cicchetti, 2000; Lefley, 1992). Moreover, research has shown that being given certain labels affects how peers will play with the labeled child, regardless of whether the child actually has the disorder in question (Harris, Milich, Corbitt, Hoover, & Brady, 1992). To date, however, there has been surprisingly little research that addresses implicit or explicit associations with autism and associated labels.
Color as an Indicator of Implicit Associations, and as Visual Rhetoric
One way to measure implicit attitudes is through the colors used to represent groups. A growing body of research indicates that colors can carry implicit meaning (Baldwin & Meunier, 1999; Elliot & Maier, 2007; Meier, Robinson, & Clore, 2004; Moller, Elliot, & Maier, 2010). Color-specific associations appear to happen very early, as young children have up to nine color-emotion pairs for which the emotion meaning can be linked to a specific color (Birren, 1978; Boyatzis & Varghese, 1994; Sharpe, 1974). Once formed, color-meaning associations can operate without conscious intention or awareness (Bargh, 1990; Elliot, Maier, Moller, Friedman, & Meinhardt, 2007; Maier, Elliot, & Lichtenfeld, 2008). For example, college students asked to complete a simple word categorization task (a modified Stroop task) responded more quickly when categorizing color-emotion matches (Meier, Robinson, & Clore, 2004). Negatively valenced words were categorized more quickly when they appeared in black, relative to white, indicating an implicit association (i.e., black=bad). In another experiment, referees were more likely to call penalties on a team with black (vs. white) uniforms in the same ambiguous game situation without conscious knowledge of the bias (Frank & Gilovich, 1988).
For the present investigation, we focused on the implicit meaning of the color red. At a physiological level, the perception of red initiates a high galvanic skin response, and is thought to elicit anxiety (Jacobs & Seuss, 1975; Weller & Livingston, 1988; Wilson, 1966). Red is often used as a warning of danger, as in stop signs, traffic lights, or most recently the U.S. Department of Homeland Security's recently abandoned color-coded system for conveying terrorist threat level. Further negative connotations to red can be observed in diverse phrases, such as in the red, seeing red, red tape, red herring, red faced, code red, red flag, and red-handed (e.g., Elliot & Maier, 2007; Elliot et al., 2007; Pryke, Andersson, Lawes, & Piper, 2001; Setchell & Wickings, 2005).
Elliot and colleagues (Elliot & Maier, 2007; Elliot, Maier, Binser, Friedman, & Pekrun, 2009; Elliot et al., 2007; Moller, Elliot, & Maier, 2010) have focused on the implicit associations that exist between red and failure. Elliot and colleagues (2007) demonstrated that brief exposure to the color red caused participants to solve fewer anagrams. When given an anagram test with a red cover, participants knocked fewer times to indicate they were ready for the test, and exhibited a stronger tendency to lean away from the test when it was administered (Elliot & Maier, 2007). The authors interpret these findings as an indication that perceiving the color red primes thoughts related to failure, thereby setting off an avoidant orientation. Recently, Moller and colleagues (2010) demonstrated even more directly the existence of an implicit association between red and failure using a modified Stroop task. In two studies, undergraduate participants were asked to categorize words as "success-related" or "failure-related," and to do so as quickly and accurately as possible by pressing buttons on a computer keyboard. Across both studies, when words related to failure appeared in red, the words were categorized by participants more quickly relative to when those same words appeared in green or the achromatic color white. In other words, when failure-related words were printed in red, categorization was facilitated. By contrast, when words related to success appeared in green, the words were categorized by participants more quickly relative to when those same words appeared in red or white.
Given these findings, it is not surprising that color is a powerful form of visual rhetoric (Garber & Hyatt, 2003). We are able to easily recognize chromatic arguments. Red, as a rhetorical device can be positive or negative based on the context, but is commonly used to indicate danger or something to which we should be alerted, possibly because of metonymical associations (e.g., red with blood; Caviano & López, 2010). Regardless, it is thought that the culture of the audience is reflected in the messages addressed to it. In particular, at places where data (charts, graphs) have to be processed rapidly (e.g., academic conferences), data presentations must facilitate an audience's comprehension of data, and must follow conventions that are recognizable and carry meaning to the audience (Kostelnik, 2007), whether implicit or explicit. Therefore, we believe that an academic conference would be an appropriate arena to examine the use of color to represent labels associated with autism.
Purpose of the Study
The purpose of this study was to examine the colors used to represent autism and related group labels in poster graphs at a major international autism research conference. Based on the premises that red represents negative concepts (such as failure or danger) in situations where evaluation of competence is salient and the notion that there is an implicit negative societal association with the label autism, we predicted that red would be the most commonly used color to represent group labels that are typically defined as being an "Autism Spectrum Disorder" (ASD), including Autism, Asperger syndrome, and Pervasive Developmental Disorder - Not Otherwise Specified (PDD-NOS). We also predicted that the use of red to represent the groups with an autism spectrum label would be significantly more frequent than the use of red to represent groups that are not considered to be part of the autism spectrum. Third, we predicted that the use of red would be greater for groups labeled specifically as having autism than for groups labeled with qualifiers such as "high-functioning autism" or "autism spectrum disorders." Finally, we predicted that the use of red would be less frequent in groups labeled as Asperger syndrome or PDD-NOS relative to groups whose label explicitly included the word autism.
Methods
Data for this study were collected from posters that were publicly on display at a major international conference on autism research. Prior to the conference, posters were randomly selected from the conference brochure for participation in the study. In each of the six poster sessions, two raters were randomly assigned 10 posters apiece. Two of the posters in each session were coded by both raters in order to measure reliability.
Graph Selection
The 108 posters, selected at random from a total of 657 posters at the conference, contained 115 graphs. Posters came from 13 different countries, although the United States, United Kingdom, and France accounted for 75% of the posters selected. Graphs were coded if they depicted more than one group (e.g., autism vs. comparison group) and/or more than one condition (e.g., time 1 vs. time 2) where comparisons could be made. If a poster contained more than one graph, the first graph was coded, and subsequent graphs were coded only if they differed from the original graph in terms of color scheme or groups. For example, if a poster that had two groups (e.g., autism vs. comparison group) and several graphs that all represented the autism group as blue and the comparison group as orange, only the first graph was coded. If, however, the second graph used green for autism and brown for the comparison group, or introduced groups other than autism versus the original comparison group, then this second graph was also coded.
From the randomly selected posters, there were several types of graphs that the coders encountered (see Table 1). First, there were graphs where colors or shading specifically differentiated between a group with an ASD label and comparison groups (Type 1 — ASD vs. comparison group, n=36 graphs). In other words, the bar or line representing the ASD group was one color, and the bar or line representing the comparison group was a different color. For these graphs, an ASD group was represented by a color 30 times and comparison groups were represented by a color 45 times (i.e., sometimes there was more than one comparison group in a graph). Type 1 graphs allowed us to make direct comparisons on color choices for ASD and comparison groups when used in the same graph.
| Graph type | Colors Differentiate | Graph Description | Example |
|---|---|---|---|
| Type 1 — ASD vs. Comparison group | ASD group versus (a) comparison group(s) | ASD group is represented by a specific color, and a/the comparison group(s) are a different color throughout the graph | Autism = blue, Typical controls = green |
| Type 2 — Between Conditions | Two within-subject conditions | Same colors used regardless of group, but different colors are used for each study condition | Time 1 = blue Time 2 = green |
| Type 3 — No Autism | Non-ASD group or condition | No ASD group depicted in the graph. Graph colors represent different non-autism groups or different conditions. | Boston area = blue New York area = green |
Note: Studies using an animal model, such as knockout mice, were considered Type 1 if the graph explicitly had an ASD or related label (e.g., "autism-like") in the graph. Otherwise, these graphs were considered to be Type 3. ASD = Autism Spectrum Disorder.
There were two types of graphs that did not use colors to differentiate between an ASD and a comparison group (Type 2 and Type 3, see Table 1). These graphs were coded in order to have representative samples of color distribution in graphs where a color did not explicitly differentiate an ASD group from another group. One of these graph types used color to signify different within-subject conditions rather than a particular group (Type 2- Between Conditions, n=67 graphs). In other words, a condition (e.g. Time 1) was represented by one color regardless of group, and a second condition (e.g. Time 2) was highlighted using a different color. In Type 2 graphs, there were 244 conditions that were represented by a color. In another type of graph, no groups contained an ASD label at all (Type 3 — No Autism, n=12). A common example of this would be a graph that represents the provision of services in different areas of a city, county, or state. Whereas Type 2 graphs included ASD groups but color did not differentiate them from other conditions, Type 3 graphs had no mention of an ASD group in the graph. Overall, there were 30 groups or conditions that were represented by a color in the Type 3 graphs.
Coding
Each rater was given a notebook that contained the list of posters they were assigned to code. They were unaware of which posters would be used for testing reliability. For each poster, the raters collected the primary affiliation of the first author, the colors used in the graph, and group labels associated with each color. Raters put each of the colors from the graph into one of the following categories: red, orange, yellow, green, blue, purple, gray, brown, black, and white. Although additional colors could have been included, pilot testing of the coding system on prints of posters presented at previous conferences revealed that as color categories became more fine-tuned, inter-rater reliability decreased (e.g., what one rater might code as fuchsia, another might code as magenta). Therefore, this specific subset of color categories was used to improve reliability.
Ratings were forced choice; in other words, if a color appeared to be in between two of the listed categories, raters were required to choose just one color label. To guide coders in choosing a label for ambiguous colors, raters were provided with a color "key," which depicted the labels that were most commonly chosen to correspond to each color during pilot testing. For forced choice responses, the raters achieved good reliability (unweighted ĸ=.70).
Results
Descriptive Characteristics
Across all graphs, regardless of group or condition, blue was the most common color used, followed by red, green, purple, and yellow (see Figure 1 for overall distribution). Red and green were the second and third most commonly used colors, despite the suggestion not to use these colors given in the pre-conference instructions to authors. It is important to note that, in the instructions to presenters that were emailed to the poster presenters several weeks before the conference, presenters were discouraged from using the colors red and green in poster graphs in order to be accommodating for attendees who were colorblind. Thus, it is possible that the use of these colors was less frequent overall because of this stipulation. It should also be noted that in our coding system, both Excel default colors (i.e., the two colors that would appear on a graph if no colors were manually selected by the author) would be coded as a shade of purple. Because purple was only used to represent 12.1% of the groups, the use of Excel defaults was not a common occurrence in these graphs.
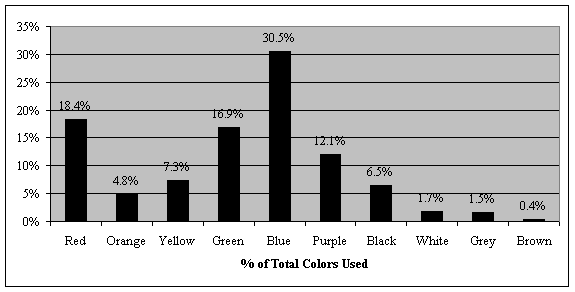
Figure 1. Distribution of colors used in a random sampling of poster graphs at an international autism conference. Numbers represent the percentage of the total number of graphs for which a color was used to highlight a group or condition in a line, bar, or section of the graph. Red represented 18.4% of poster graphs, orange 4.8%, yellow 7.3%, green 16.9%, blue 30.5%, purple 12.1%, black 6.5%, white 1.7%, grey 1.5%, and brown 0.4%.
Main Analyses
First, we examined the Type 1 graphs to compare the distribution of colors used to represent ASD vs. comparison groups (see Figure 2). The overall distribution of colors used for ASD (n=30) and comparison groups (n=45) were significantly different, Χ2=19.28, p<.05. We then used a 2x2 Chi-square to directly compare the use of red to that of all other colors combined in each group. Red was used to represent an ASD group significantly more often than comparison groups, Χ2=10.30, p<.01. As predicted, red was the most commonly used color to represent groups with an ASD label1 (50%). For comparison groups, however, green was the most commonly used color, followed by blue and purple. This is striking, given that across all graphs, blue is the most commonly used color (Figure 2). Thus, poster authors used a significantly different color distribution for posters comparing an ASD group to a comparison group than for posters in general, and red was used more frequently to represent an ASD group than comparison groups.
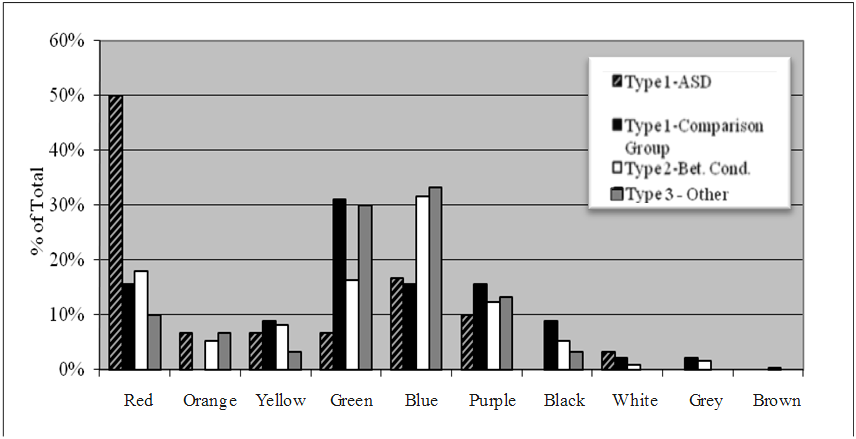
Figure 2. Color distribution used in graphs when the purpose or designation of the color is considered. In the sample graph color could specifically designate a group labeled with an autism spectrum disorder (Type 1), a comparison group that does not have an autism spectrum disorder diagnosis (Type 1), comparisons between experimental conditions rather than groups (Type 2), or when graphs are not about autism (Type 3). ASD=Autism Spectrum Disorder.
Next, we compared the colors used to represent ASD groups in the Type 1 graphs to the colors used to depict contrast conditions in the Type 2 graphs (n=244, see Figure 2). The Type 2 graphs were thought to be more representative of the normal distribution of colors that would be used in graphs in general, because they do not differentiate between groups. Overall, the distributions were significantly different, Χ2=20.34, p<.05. Moreover, a group with an ASD label was significantly more likely to be represented by red than were conditions in Type 2 graphs, Χ2=16.16, p<.001. When colors signified conditions (as opposed to groups), blue was almost two times more likely to be used than any other color.
The color distribution was then explored within Type 3 graphs, which made no mention of an ASD group (n=30, see Figure 2). The color distribution of Type 3 (no ASD) groups was significantly different from the color distribution within groups with an ASD label in Type 1 graphs, Χ2=16.60, p<.05. An ASD group was significantly more likely to be represented by red than were groups in Type 3 graphs, Χ2=11.43, p<.01. In Type 3 graphs, blue was the most commonly used color, followed by green and purple. Red was used relatively infrequently in these graphs (10%).
Comparisons within the Spectrum Labels
Figure 3 shows the percentage of times red was used to represent a group or condition when all ASD diagnostic labels are considered separately. For these analyses, we split the ASD groups as represented in Type 1 graphs into three groups (Autism, n=14; ASD/HFA, n=10; Asperger syndrome, n=5) based on the explicit label used by the poster author in the graph. We predicted that adding qualifiers (such as "high-functioning" or "spectrum disorder") would reduce the frequency that red was used, and that Asperger syndrome would have the lowest frequency of red use. As predicted, red was most commonly used to represent autism groups (64%), followed by HFA/ASD groups (50%), and then by Asperger syndrome groups (20%).
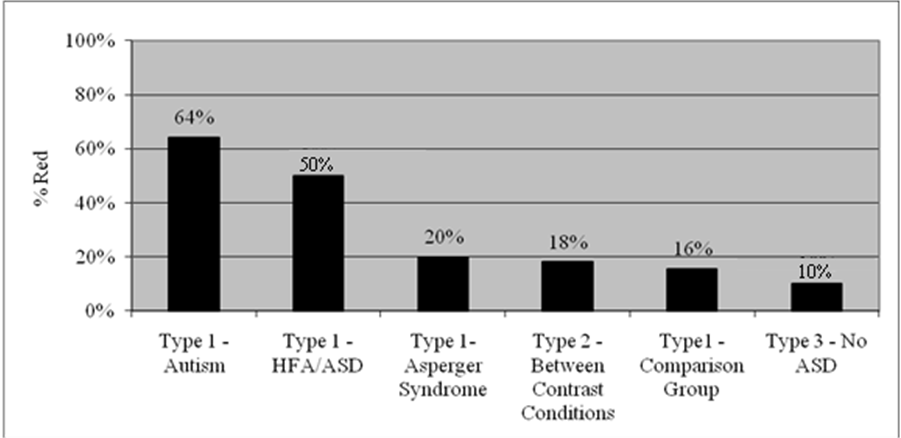
Figure 3. Percentage of times red was used to represent a particular group or contrast condition when subcategories of autism spectrum disorder labels are considered. Type 1 graphs are split into four (autism, HFA/ASD, Asperger Syndrome, comparison groups). These categories were determined by the explicit terminology used by the authors to describe the group that was being represented in the graph. ASD = Autism Spectrum Disorder, HFA = High-Functioning Autism.
Discussion
This study examined the colors that were chosen to represent autism and associated spectrum labels in poster graphs at an international autism conference. Findings indicated that, even though blue was the most commonly used color in graphs, red was the most commonly used color to represent groups with an autism spectrum label. Red was used more frequently in graphs that represented ASDs: relative to comparison groups (Type 1 graphs), relative to graphs where comparisons were between contrast conditions (Type 2 graphs), and relative to graphs that did not contain an autism group at all (Type 3 graphs). Within the autism spectrum, the use of red was most common when the word "autism" labeled a group (64%), followed by labels that added a qualifier to autism, such as "high-functioning" or "spectrum disorder" (50%), and then by the label "Asperger syndrome" (20%; note that no graphs contained a PDD-NOS label). As a whole, these findings are especially striking, given that all poster presenters were explicitly encouraged not to use red and green in their graphs in the "Instructions to Poster Presenters" section of a pre-conference email.
We argue that these findings are indicative of implicit negative social conceptions associated with the label autism. It is clear from previous research that color conveys meaning, often implicitly (see Elliot & Maier, 2007, for a review of this topic). Specifically, research has shown that the color red is implicitly linked to the concept of failure and negative concepts more generally (e.g., Elliot et al., 2007; Moller et al., 2010; Pryke et al., 2001; Setchell & Wickings, 2005). The findings from the current study are consistent with this literature in so far as a group that is often described as impaired (ASD) was more likely to be represented by the color red in a graph. Interestingly, qualitative examples of groups or contrast conditions without an autism spectrum label who were represented by red included "severe language deficits," "infertility," "inverted," "non-native deviant," "socially impaired," and simply "problems".
Our interpretation of these findings is that the investigators labeling the graphs included in this study chose the color red because of an implicit association between an ASD label and negative attributes, such as incompetence and danger. There is no question that, as a diagnosis and a label, autism has had a controversial history. For a large part of the 20th century, theories suggested that poor parenting played a direct causal role in a child developing autism (Bettelheim, 1967; Kanner, 1949). Although this idea has been resoundingly refuted in the clinical literature (e.g., Cantwell, Baker, & Rutter, 1979; Cox, Rutter, Newman, & Bartak, 1975; Rimland, 1964; Roazen, 1992), the perception of parent culpability continued to persist for some time (Grinker, 2007; Pollak, 1997). Parents of individuals with an autism spectrum diagnosis still report high levels of both enacted and felt stigma (Gray, 1993; 2002). Even today, the words used to describe the diagnosis in the clinical literature and in popular culture tend to portray it as a mystery (e.g., as a puzzle or something that contains "secrets") or a threat (e.g., something we are "fighting;" Rocque, 2010). Moreover, there is a tendency to create artificial group boundaries within the diagnosis and between those with and without the diagnosis (Yergeau, 2010), even though there is little research support for these categorical group demarcations, and in the context of a discussion where the diagnoses are part of a "spectrum" (e.g., Diehl & Berkovits, 2010). Our findings suggest that negative associations with the terminology operate on an implicit level, and it is quite possible that these associations seep into the public discourse about the diagnosis.
More broadly, we believe that the process of distancing the word autism from the label of some (but not all) individuals with the diagnosis does more than highlight the diversity of the diagnosis; it reinforces the stigma associated with portions of the population who are not considered "high-functioning." This is not specific to the autism label; it has been argued that highlighting levels of ability for other labels related to mental/cognitive disabilities reinforces the stigma associated with those individuals on the "lower" end (e.g., Lewiecki-Wilson, 2003). The "spectrum" metaphor is meaningful, when viewed in the context of this paper, and not just because red is the color on the spectrum with the lowest frequency. The metaphor highlights a diversity of levels of functioning in addition to the prototypical "low-functioning" or "classic" autism.
It should be noted that, because research has not found categorical differences between autism, Asperger syndrome, and other PDDs, it has been proposed that the new diagnostic manual should only contain a singular construct (Autism Spectrum Disorder), with specifications for "severity" level. It is interesting that the new label is Autism Spectrum Disorder, and not just autism, if all of the previous labels are just considered to be part of one condition. The levels of "severity" were designed to clarify the level of supports needed for each individual. Crucially, though, the word "severity" seems unnecessary, given that the focus of the criteria is on adaptive supports. Based on our findings and previous research on labels and intellectual and developmental disabilities (e.g., Lewiecki-Wilson, 2003), both the necessity of the use of the ASD label and the "severity" specifier could be related to implicit negative conceptions of the term autism, and thus reinforce the stigma for individuals considered to have lower levels of functioning.
Understanding how ASD is represented within the research community may be especially important, as the attitudes expressed by scientists studying ASD affect to a large degree how this diagnosis is represented by the popular media, and ultimately understood by the general public. We now understand that the colors we use as labels carry implicit meaning and that ASD researchers are using colored labels in systematic ways. This may reflect an inherent bias in autism researchers, consistent with what some have argued (e.g., Rocque, 2010). Others might argue that autism researchers should carry less of a negative association to the ASD label given that it is their chosen profession. If the latter is true, it makes the present results even more striking in that it suggests an implicit, negative societal association with the autism label that manifests even among those who have dedicated their careers to children with an autism diagnosis and their families. Given these observations, we think it's important to better inform the ASD research community about the potential for subtle choices (such as the colors used to label their graphs and figures) to inadvertently influence how ASD is widely viewed, and indirectly, how people with an ASD label are treated.
Limitations and Future Directions of Research
An alternate interpretation of our findings is that in the context of research presentations /posters, red could represent the group that a researcher wants to highlight, rather than an implicit perception related to that group. At an autism conference, it would follow that an ASD group would be more likely to be highlighted in graphs to draw attention to the important data. Still, this hypothesis does not account well for the differences observed between various autism spectrum disorder labels in this study. It also does not explain why the use of red was significantly less frequent in graphs that did not include groups with an ASD label but presumably still had a condition of interest to highlight. Still, future research using this methodology should attempt to replicate this pattern at a venue where a specific disorder is not the focus of the conference, such as at a general child development conference.
A second limitation of this study was the small number of graphs representing potential labels of interest, making it difficult to draw definitive conclusions about the distribution of colors that would be used for these populations. There were only five graphs that specified Asperger syndrome as a group label, and none that explicitly used PDD-NOS. Also, there were very few instances of comparison groups with a specific disability/disorder label that was not considered to be on the autism spectrum (n=13), although red was never used to represent these groups in the instances when they did occur. Future studies should utilize stratification in the random selection process in order to ensure that all ASD labels are meaningfully represented in terms of sample size.
Future research on this topic should consider both the implicit nature of negative associations, and societal factors that might be perpetuating these negative conceptions. Contemporary reaction time study designs measure differences in participants' responses to stimuli on the order of milliseconds, thereby providing a window into implicit or nonconscious attitudes that may not be explicitly articulated or measured via self-report (Gawronski & Payne, 2010). Tools like these may be used in the future to explore whether the effect demonstrated in this study is, in fact, nonconscious. For example, several paradigms have been developed that demonstrate implicit associations between words and colors can increase reaction time. On a broader level, it would be fruitful to explore the relationship of "awareness" campaigns to negative conceptions. It is possible that the success of these campaigns at raising awareness, but not knowledge of autism has contributed to the perpetuation of negative associations with autism.
Implications for Research and Practice
One message to take from this study is that there may be negative social conceptions associated with the label autism that operate at an implicit level, outside of conscious awareness. Importantly, even if we assume no implicit prejudice on the part of the researcher, it should be seriously considered that colors used to represent a group in a graph may implicitly communicate unintended meaning to a presenter's audience. There may be inadvertent consequences for using red to represent ASDs or any specific group with a disability in posters, presentations, on book covers, and in other media. That is, using red may contribute to inadvertently perpetuating negative implicit attitudes towards individuals with the autism label.
Additionally, it is possible that different representations of disorders in the autism spectrum could lead the children to be perceived differently in research, educational, or other settings. Research has clearly shown that labels affect the interpretation of ambiguous behavior (Hart et al., 1997; Hinshaw & Cicchetti, 2000; Lefley, 1992; Woods et al., 1998). If the findings from this study are interpreted as an indication of implicit or nonconscious differences in the representation and perception of specific ASD labels within the research community, then subjective measurements of behavior, especially if they are collected or coded during the course of a testing session, are potentially susceptible to such implicit biases. Moreover, implicit reactions or biases associated with a diagnosis could very likely effect how a teacher or therapist behaves around a child with an autism spectrum label. Exploring these issues warrants significant empirical attention in the future.
Conclusions
In sum, the autism label appears to carry implicit negative associations, even among those within the ASD research community, and the degree of these associations are affected by whether or not there is a qualifier on the label. This association is likely to affect the way individuals with the diagnosis are treated, and it is also likely to be related to the negative tone that pervades the public discourse about the diagnosis. More research is needed to explore further how labels for ASDs and other disabilities affect how people with these diagnoses are perceived in research, education, and treatment.
This research was supported in part by NIMH grant T32 MH1018268-22 (J. Leckman, P.I.).
Works Cited
- American Psychiatric Association. (2000). Diagnostic and statistical manual of mental disorders (4th ed., text revision). Arlington: Author.
- Baldwin, M.W., & Meunier, J. (1999). The cued activation of attachment relational schemas. Social Cognition, 17, 209-227.
- Bargh, J.A. (1990). Auto-motives: Preconcious determinants of social interaction. In E.T. Higgins & R. Sorrentino (Eds.), Handbook of motivation and cognition (Vol. 2, pp. 93-130). New York: Guilford Press.
- Bettelheim, B. (1959). Feral children and autistic children. American Journal of Sociology, 64, 455-467.
- Bettelheim, B. (1967). The empty fortress; Infantile autism and the birth of the self. New York: The Free Press.
- Birren, F. (1978). Color and human response. New York: Van Nostrand Reinhold Company.
- Boyatzis, C.J., & Varghese, R. (1994). Children's emotional associations with colors. Journal of Genetic Psychology, 155, 77-85.
- Campbell, J.M. (2006). Changing children's attitudes toward autism: A process of persuasive communication. Journal of Developmental and Physical Disabilities, 18, 251-272.
- Campbell, J.M., Ferguson, J.E., Herzinger, C.V., Jackson, J.N., & Marino, C.A. (2004). Combined descriptive and explanatory information improves peers' perceptions of autism. Research in Developmental Disabilities, 25, 321-339.
- Cantwell, D.P., Baker, L., & Rutter, M. (1979). Families of autistic and dysphasic children. Archives of General Psychiatry, 36, 682-687.
- Caviano, J.L., & López, M.A. (2010). How color rhetoric is used to persuade: Chromatic argumentation in visual statements. Colour: Design & Creativity, 5, 1-11.
- Cox, A., Rutter, M., Newman, S., & Bartak, L. (1975). A comparative study of infantile autism and specific developmental receptive language disorder: II. Parental characteristics. British Journal of Psychiatry, 126, 146-159.
- Diehl, J.J., & Berkovits, L. (2010). Is prosody a diagnostic and cognitive bellwether of autism spectrum disorders? In A. Harrison (Ed.), Speech disorders: Causes, treatments, and social effects (pp. 159-176). New York: Nova Science Publishers, Inc.
- Diehl, J.J., Tang, K., & Thomas, B. (in press). High-functioning autism. In F. Volkmar (Ed.), Encyclopedia of Autism Spectrum Disorders. New York: Springer-Verlag New York Inc.
- Down, J. (1887). On some of the mental affections of childhood and youth. London: Churchill.
- Elliot, A.J., & Maier, M.A. (2007). Color and psychological functioning. Current Directions in Psychological Science, 16, 250-254.
- Elliot, A.J., Maier, M.A., Binser, M.J., Friedman, R, & Pekrun, R. (2009). The effect of red on avoidance behavior in achievement contexts. Personality and Social Psychology Bulletin, 35, 365-375.
- Elliot, A.J., Maier, M.A., Moller, A.C., Friedman, R., & Meinhardt, J. (2007). Color and psychological functioning: The effect of red on performance attainment. Journal of Experimental Psychology, 136, 154-168.
- Farrington, D.P. (1977). The effects of public labeling. British Journal of Criminology, 17, 112-125.
- Frank, M.G., & Gilovich, T. (1988). The dark side of self and social perception: Black uniforms and aggression in professional sports. Journal of Personality and Social Psychology, 54, 74-85.
- Frith, U. (2003). Autism: Explaining the enigma (2nd ed.). Oxford: Blackwell.
- Frith, U. (2004). Emanuel Miller lecture: Confusions and controversies about Asperger syndrome. Journal of Child Psychology and Psychiatry, 45, 672-686.
- Garber, L.L., & Hyatt, E.M. (2003). Color as a tool for visual persuasion. In L.M. Scott & R. Batra (Eds.), Persuasive Imagery: A Consumer Response Perspective (pp. 313-336). New Jersey: Lawrence Erlbaum Associates.
- Gawronski, B., & Payne, B.K. (2010). Handbook of implicit social cognition: Measurement, theory, and applications. The Guilford Press: New York.
- Gray, D.E. (1993). Perceptions of stigma: The parents of autistic children. Sociology of Health & Illness, 15, 102-120.
- Gray, D.E. (2002). "Everybody just freezes. Everybody is just embarrassed": Felt and enacted stigma among parents of children with high-functioning autism. Sociology of Health & Illness, 24, 734-749.
- Green, S., Davis, C., Karshmer, E., Marsh, P., & Straight, B. (2005). Living stigma: The impact of labeling, stereotyping, separation, status loss, and discrimination in the lives of individuals with disabilities and their families. Sociological Inquiry, 75, 197-215.
- Grinker, R.R. (2007). Unstrange minds: Remapping the world of autism. New York: Basic Books.
- Harris, M.J., Milich, R., Corbitt, E.M., Hoover, D.W., & Brady, M. (1992). Self-fulfilling effects of stigmatizing information on children's social interactions. Journal of Personality and Social Psychology, 63, 41-50.
- Hart, S., Field, T., Stern, M., & Johnes, N. (1997). Depressed fathers' stereotyping of infants labeled as 'depressed.' Infant Mental Health Journal, 18, 436-445.
- Hinshaw, S.P., & Cicchetti, D. (2000). Stigma and mental disorder: Conceptions of illness, public attitudes, personal disclosure, and social policy. Development and Psychopathology, 12, 555-598.
- Jacobs, K.W., & Seuss, J.F. (1975). Effects of four psychological primary colors on anxiety state. Perceptual and Motor Skills, 41, 207-210.
- Kanner, L. (1949). Problems of nosology and psychodynamics of early infantile autism. American Journal of Orthopsychiatry, 19, 416-426.
- Kostelnik, C. (2007). The visual rhetoric of data displays. IEEE Transactions on Professional Communication, 50(4), 280-294.
- Lefley, H.P. (1992). The stigmatized family. In P.J.F.A. Tasman (Ed.), Stigma and mental illness (pp. 127-138). Washington, D.C.: American Psychiatric Press.
- Lewiecki-Wilson, C. (2003). Rethinking rhetoric through mental disabilities. Rhetoric Review, 22(2), 156-167.
- Maier, M.A., Elliot, A.J., & Lichtenfeld, S. (2008). Nonconscious avoidance motivation mediates the negative effect of red on intellectual performance. Personality and Social Psychology Bulletin, 34, 1530-1540.
- Meier, B.P., Robinson, M.D., & Clore, G.L. (2004). Why good guys wear white: Automatic inferences about stimulus valence based on brightness. Psychological Science, 15, 82-87.
- Moller, A.C., Elliot, A.J., & Maier, M. (2010). Basic hue-meaning associations. Emotion, 9, 898-902.
- Nowicki, E.A., & Sandieson, R. (2002). A meta-analysis of school-age children's attitudes towards persons with physical or intellectual disabilities. International Journal of Disability, Development, and Education, 49, 243-265.
- Pollak, R. (1997). The creation of Dr. B.: A biography of Bruno Bettelheim. New York: Simon and Schuster.
- Pryke, S.R., Andersson, S., Lawes, M.J., & Piper, S.E. (2001). Carotenoid status signaling in captive and wild red-collared widowbirds: Independent effects of badge size and color. Behavioral Ecology, 13, 622-631.
- Rimland, B. (1964). Autism: The syndrome and its implications for a neural theory of behavior. Upper Saddle River, N.J.: Prentice-Hall.
- Roazen, P. (1992). The rise and fall of Bruno Bettelheim. Psychohistory Review: Studies of motivation in history and culture, 20, 221-250.
- Rocque, B. (2010). Science Fictions: Figuring autism as a threat and a mystery in medico-therapeutic literature. Disability Studies Quarterly, 30(1). Retrieved from http://www.dsq-sds.org/article/view/1064
- Setchell, J.M., & Wickings, E.J. (2005). Dominance, status signals, and coloration in male mandrills (mandrillus sphinx). Ethology, 111, 25-50.
- Sharpe, D.T. (1974). The psychology of color and design. Chicago: Nelson-Hall Inc.
- Swaim, K.F., & Morgan, S.B. (2001). Children's attitudes and behavioral intentions toward a peer with autistic behaviors: Does a brief educational intervention have an effect? Journal of Autism and Developmental Disorders, 31, 195-205.
- Volkmar, F.R., Lord, C., Bailey, A., Schultz, R.T., & Klin, A. (2004). Autism and pervasive developmental disorders. Journal of Child Psychology and Psychiatry, 45, 135-170.
- Weller, L., & Livingston, R. (1988). Effects of color of questionnaire on emotion responses. Journal of General Psychology, 115, 433-440.
- Wilson, G.D. (1966). Arousal properties of red versus green. Perceptual and Motor Skills, 23, 942-949.
- Woods, N.S., Eyler, F.D., Conlon, M., Behnke, M., & Webie, K. (1998). Pygmalion in the cradle: Observer bias against cocaine-exposed infants. Journal of Developmental and Behavioral Pediatrics, 19, 283-285.
- Yergeau, M. (2010). Circle Wars: Reshaping the typical autism essay. Disability Studies Quarterly, 30(1). Retrieved from http://www.dsq-sds.org/article/view/1063/1222
Endnotes
-
It should be noted that eight graphs differentiated groups by shading (darker vs. lighter) rather than hue. Previous research very strongly indicates negative associations with darker versus lighter shades (Frank & Gilovich, 1988; Maier et al., 2004; Vrij, 1997). Both raters made note of shading for relevant graphs (e.g., Group A was dark blue, Group B was light blue). In this sample, it should be noted that the ASD groups were the darker group and the control group the lighter group in 100% (all eight) of the graphs.
Return to Text
